
Bonus tutorial 05 - DIY Contour Maps
2014-05-01 00:00:00This post is part of a series of tutorials about using open source software for permaculture design. Here are the links to the rest of the series: Getting the software, getting an aerial photo, making a contour map, google earth contours.
This challenge is the first one that will take you outside and get mud on your boots - this week we're going to put on our surveyors' hats and make our very own detailed contour maps for small spaces. This is a big set of instructions, so buckle up, it's going to be a long ride this week...
First, a big disclaimer. This is by far (really far) the most involved tutorial I plan to do. If you do this, you will be learning how to do a basic survey of a site from scratch. This is NOT necessary for 99.9% of your use cases, but I thought it would be something that a few of you would be interested in knowing how to do. If you don't want to do this, there's absolutely no need to, and you can go on happily about your business knowing that if you ever want to try it later, it'll still be here! I almost hesitate to post this because I'm afraid it might stress some of you out, so let me emphasize one last time: This (even more than the other tutorials in the series) is purely optional, for those who are interested and have the time to try it!!! If you feel at all overwhelmed, just skip it and you'll be no worse off.
Now, with that out of the way, we have a lot of instructions here for what you'll see is actually a pretty simple process. If you read through it all and try it out, you'll see that it takes way longer to describe it than it does to actually do it, and you can get a contour map for a small area done in an afternoon with some practice.
How to make contour maps
From a high level, making a contour map is a really simple process. We're basically going to locate a bunch of points on the surface of our site in three dimensions, then use them to figure out where the level lines should be. Measuring the first two dimensions is pretty easy. We set up a base line, and then measure how far we have to go along the line and away from the line to reach the points. Measuring the elevation requires a bit more technology - we need some way to figure out how much higher one point is than another. I'll talk about three different tools we can use to do this: the water level, the survey transit (dumpy level), and the sight level. Each has pros and cons, but they'll all get the job done.
Locating points
The essence of our job here is to locate a bunch of points as accurately as we can manage. On top of that, it's important which points we pick as well - not all points are created equally if you want to get a good representation of your terrain, so let's start with that.
Which points to locate
The process we'll use to make the contour map is going to assume that all of our measured points are basically connected with straight lines (this is called linear interpolation, if you're interested in the math). What that means is that we'll end up with a map that looks like we took each pair of nearby points and laid a ruler between them and said "that's the ground!" So, if we want to get a good map, we should try to pick points that are connected by reasonably straight lines on the actual ground.
In practical terms, this means that we want to measure points in places where the slope changes - not so much where it's staying the same. So we'd measure the top and bottom of a hill with more detail than the steadily sloping sides.
Here's a picture to illustrate good points and bad points to pick:
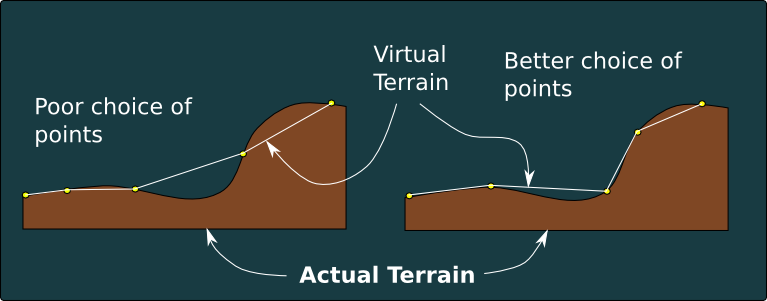
In the picture, you have to imagine somebody cut the ground and you're looking at the slope from the side. I drew in what the "virtual landscape" we'll create with our contour map will look like in each case, and you can see that the set of points on the right is a much better match than the one on the left even though they both have the same number of measurements.
Laying out the map
Okay, now that you know which points are the best, the next step is to figure out how to make the points you pick match up with points on your map. This is the trickiest operation in the whole project - we have a fuzzy 2D representation of an immensely complex 3D world, and we want to project the measurements of the world onto the representation so that they make sense. We're going to do this by locating a couple of known features using our satellite photo, measuring to establish scale, and laying out a base line.
- Get a copy of your aerial photo and look at it. Try to find something reasonably large (on the order of the size of the space you're going to map) that you can measure accurately. For example, if you're doing an urban lot, measuring the side length of the house or the width of the driveway might be a good choice. You want to pick something that has very distinct edges that don't change over time, so that you can identify them readily in your map and on the ground.
- Measure your distance with something like a tape measure. You want this to be an accurate measurement, because it's going to determine the accuracy of the scale for the entire map. If you're using a building for your base measure, make sure to measure the roof length, not the wall. You can see the roof from the photo but not the wall!
- In inkscape, find the same points to measure
- Select the Pen tool (shift + F6 or
 )
) - Click one of your points
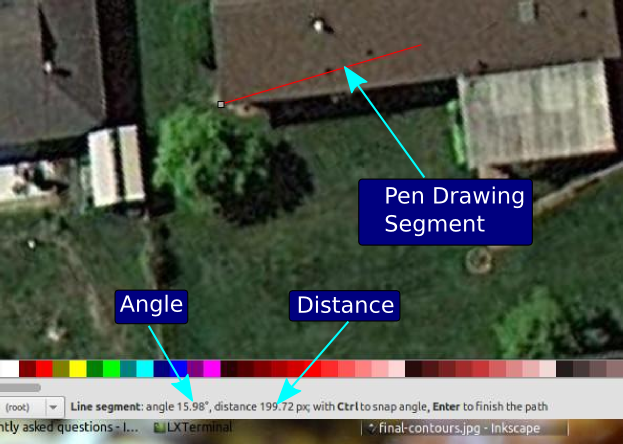
- Move the other end to your other point, and look at the distance measure at the bottom of the screen (see image below).
- Write down both the inkscape distance and the real distance.
- Divide the inkscape distance by the real distance to get your scale. If you're measuring in feet, this will give you a scale in pixels per foot. Make sure you're consistent with your unit of measurement (feet,meters,furlongs...) from here on out- if your measure here was in feet, everything else you measure should also be in feet! Otherwise you'll end up like NASA...
Here's how to find the distance in inkscape:
Next, we're going to lay out a base line on the ground and on the map. The base line is going to be the starting point for all of our measurements.
- Either use the same feature from before, or identify another feature in your photo that you can use to run a string alongside. You need to have at least one end that you can locate very accurately. The goal here is to relate the photo to the real world in as accurate a way as possible - if you have a wall to use, that will let you draw in your base line very accurately with minimal hassle. Other good candidates are roads, pairs of utility poles, or anything else you can reliably locate on both the map and the ground. Trees are not good for this because the canopy makes it hard to know exactly where the trunk is.
- Using a string and two stakes, stretch a line that spans the whole space that you want to map. If your space is too big to span in one shot, you'll need to repeat this whole mapping process for swatches of the property where you can establish good baselines.
- Draw the baseline in on your map.
- Multiply your measured baseline length by your scale to find the pixel length of your baseline.
- Select the pen tool (shift+f6, or click the ink pen)
- Click on your base point
- Watching the length of the line as you move, draw a line in the direction of your base line until the length matches what you calculated in step (1). When the length is right, double click to end the baseline
Okay, we're all set to do some mapping now!
Measuring point elevations
Each point we want to measure is going to have three parts: First, the distance from the baseline. Second, the distance along the baseline that we have to walk to get to the spot where the point is closest to the line (perpendicular). Third, we need to have the relative elevation of the point.
Here's a picture of what we're measuring:
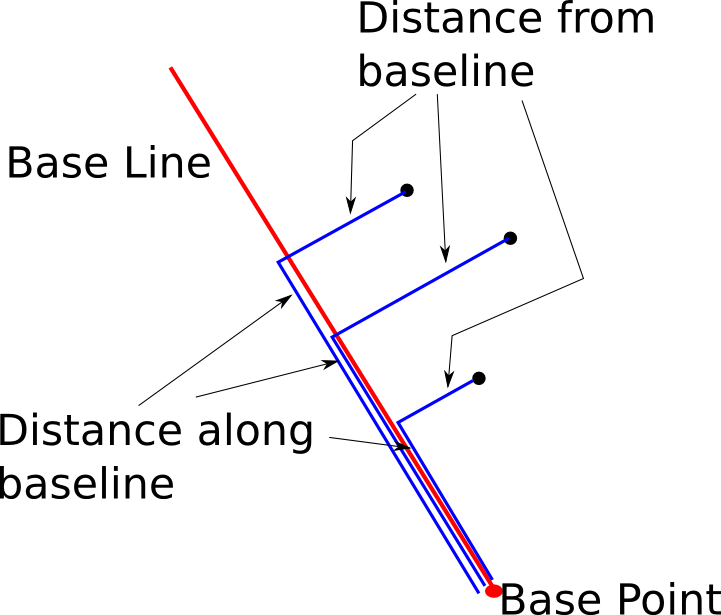
The way we'll actually do this is to just walk around picking interesting points to measure and putting flags on them. When you've got your interesting points flagged, you can measure all of their locations relative to the base line and their elevations. Later you'll use these coordinates to plot them on your map.
Measuring the elevation of a point can be done in a variety of ways, depending on what kind of gear you have available. I'll talk about three things here - a water level (most accurate, but limited distance), a survey transit or dumpy level (good accuracy, good range, but expensive), and a sight level (less accurate, but very inexpensive, and you can operate it without help). In all three cases, what we're going to do is arbitrarily pick a spot on the property to call "zero" elevation. Then, we'll use that spot to measure the change in elevation from there to every point we marked. That will let us calculate the slopes and generate our contour map. Note that we don't need to know the distance above sea level to get this done.
If your site has a lot of elevation change, you'll have to do this process multiple times because you'll exceed the range of your equipment (i.e. the staff is too short, or you're not tall enough). If that happens, just relocate your measuring system to one of the points you already measured and use that as a new base reference. You'll just have to remember to add the new base point's elevation to all of the points you measure from it.
The Water Level
Water levels are awesome if you need to measure things with extreme accuracy in a small space. The basic idea is this: you get a bucket of water, attach a hose to the bottom of it, and then you measure the distance from the ground to the water line in the other end of the hose (which gets dragged around all over the yard with you) to get the elevation. The reason you need the bucket is that it acts as a buffer against changes in the volume of the hose caused by bending it, stepping on it, and having it sitting in the sun. Without the bucket, you can get a change of several inches as a result of laying the hose in a different way (this happened to me, so it's not just a theoretical problem!). The water level in the bucket changes much less when that happens because it's so much bigger than the hose, so you can get better measurements. Here's a diagram of the apparatus:
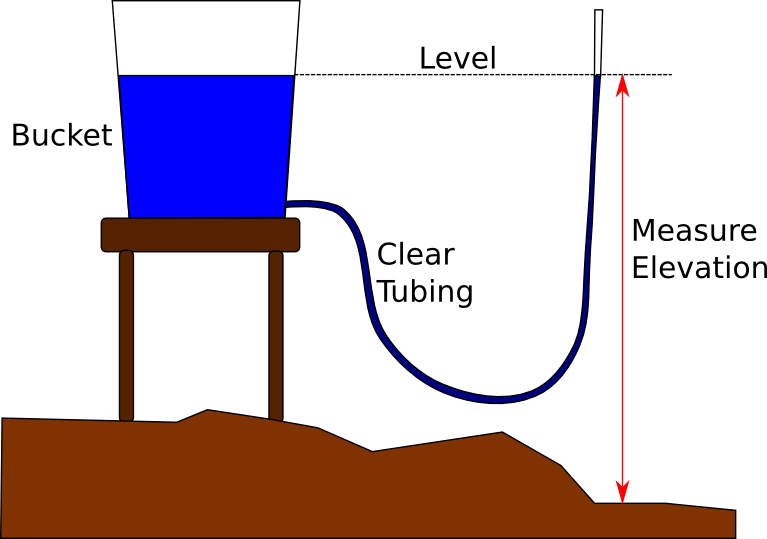
Here's a link to a page with construction instructions: DIY Water Level. Other pages on that same site have a pre-made water level for sale as well, but I have no idea whether it's worth it or not. They're very easy to make for yourself.
Here's the measurement process for our project, using the water level:
- Build the level and fill it with colored water (use anything you have handy for the color - food coloring, beet juice, etc.). The color makes it much easier to see the water line in the clear tubing.
- With the water level built and filled, put the bucket at a relatively high spot on the property. If it's on a low spot you won't be able to see the water line in the hose, and you won't be able to measure anything! You can also put it on top of a chair or something to get a little extra height to work with.
- Walk to each location you want to measure and use a tape measure (or you can draw a scale on the pole, this is easier) to find the distance from the ground to the water line in the water level.
- Note the distance on the map and repeat.
There is an alternative way to use a water level that doesn't require a bucket, but you'll need a helper. In this case, you just fill the tube with water and have your helper hold one end of it so that the water line is at a reference mark. They'll have to move the hose up and down as you move around, but as long as there are no kinks or air bubbles, the water level will always be the same in both ends of the hose. That means that once your helper has the mark lined up with the water level, you can measure the water level just the same way as above.
The Survey Transit
You'll need a helper for this one. If you've never used a transit before, it's very simple. You just get the scope set up on the tripod, then use the adjusting screws on the bottom to make sure it's dead level no matter which direction it's pointed. After that, you can look through it, and anything that's on the crosshairs will be level with your eye. The measurement process is very similar to the water level:
- Have your helper set up the transit on a location so that they can see over the top of the tallest feature you want to measure. The transit doesn't have to be on top of it because it's usually 4-5 feet off the ground already, but it does need to be able to see over the top from where it's positioned.
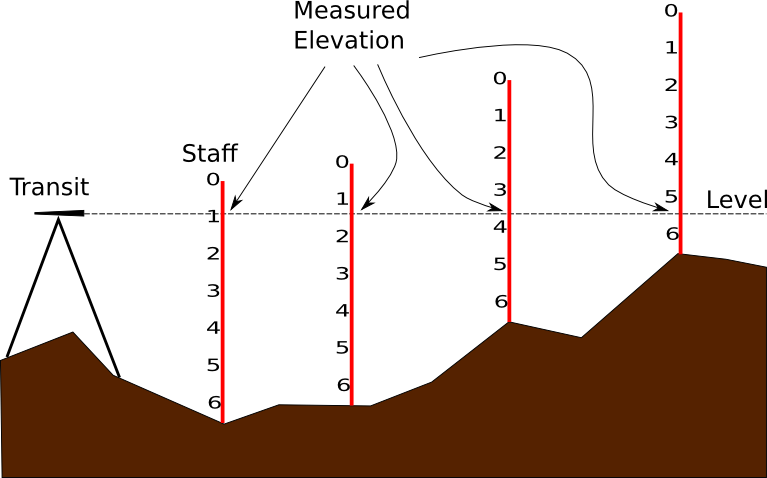
- Use the marked staff (you can use a tape measure rubber-banded to a stick, as in the image below) at each of your flagged points, and have your helper read off the number on the staff for you. That's your elevation for that spot, so mark it on the map. In this case, you want to set up your staff so that the numbers start at the top and get larger as you go down, not up, to make the elevation calculation a bit simpler (otherwise you'll have to subtract all of them from some larger number later).
- Repeat for each location.
Here's what the basic setup looks like for using a survey transit:
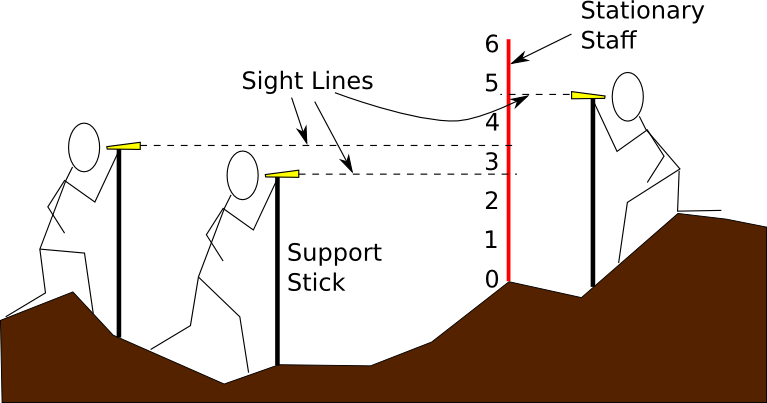
The Sight Level
This is probably the cheapest overall, and requires the least setup. Unfortunately, it also gives the lowest accuracy results (though they can still be good enough). The issue is that a sight level is generally not a precision instrument, so your sightings for level are going to have more error. You can compensate for that to some degree if you want by taking three sightings at each spot and using the average:
- Set up a stationary staff in a place where you can read it from all of your measurement points. The staff should be divided into small sections (6-inch or 10-cm for example) using something that's very easy to see. You don't have to number the divisions because you probably can't read them anyway looking through the level. I made mine by taking a long stick and drawing black lines with charcoal around it at 6-inch intervals, double thick for every other one.
- Get another stick that comes up to about your chin when you stand it on end. You'll be using this to brace the sight level when you read it to get more consistent measurements.
- Walk to each point you want to survey, hold the sight level on the end of the stick, look at your scale (making sure the level bubble is in the center), and write the number you see at the crosshair line down on your map.
- Stand up, remove the sight level from the stick, and then repeat step 3 and this step two more times (if you want to get the higher accuracy).
- Move to the other points on your map and repeat for each.
- After all of your points are done, go through each point and add the three numbers together, then divide the result by three. That will be the elevation you use. Note that if you used imperial units, you'll need to convert them to decimal representation instead of feet and inches (i.e. 3 feet 6 inches becomes 3.5 feet) otherwise the average is more of a hassle to compute.
Here's an image showing the basic idea of how to use a sight level for this:
Making the map
Now that we have elevation points located on our maps, the next step is to turn them into contour lines. This part is a little bit mathy - but don't let that dampen your spirits. Here's how it works: First, we connect the points we made together in a triangular net. Then, we'll do a quick calculation on each of those edges to figure out where our contour lines should cross them. We'll mark dots on each edge for the contour, then connect the dots and we're done!
- Transcribe your hand-drawn points into your inkscape drawing.
- Start at your baseline, and use the pen tool to draw a line along the baseline to the distance needed for your first point.
- Continue the line from there, turning to go perpendicular and making the line as long as the distance from the baseline to your point.
- Click where your point should be and press enter to end the line.
- Use the text tool
 to
enter the measurement for that point near the end of the line. If you
need to resize and set the color, it'll be convenient to copy (ctrl+c)
and paste (ctrl+v) this for each additional point rather than making
it over again.
to
enter the measurement for that point near the end of the line. If you
need to resize and set the color, it'll be convenient to copy (ctrl+c)
and paste (ctrl+v) this for each additional point rather than making
it over again. - Repeat this process for each point.
-
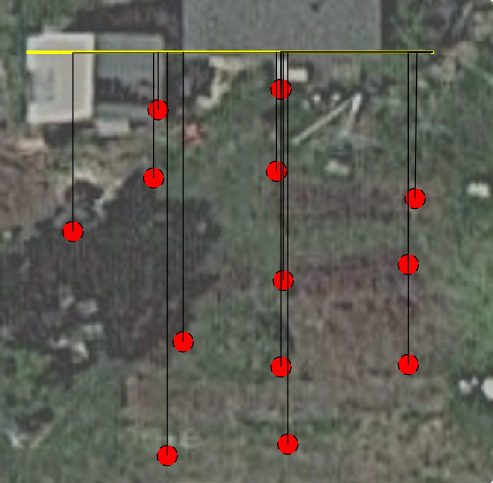
Make point markers so your points are easy to find.
- Make a new layer called "dots" and set it active
- Turn on snap to cusp nodes
 and snap to object centers
- Draw a small circle using the circle tool (F5)

- Set the fill color to something easy to see
- Select the circle, then press ctrl+c to copy it
- Move your mouse pointer to the tip of each of the lines that represent
your points and press ctrl+v to put a circle there, centered on your
line. After you paste the circle, you can click it to move it around,
and you'll see a little indicator that it's going to snap the center to
the endpoint. When you see that, let it go and it'll be in exactly the
right place. It will probably help to zoom in pretty close to get the
positioning right - the snap region is pretty big for inkscape and if you're
zoomed too far out it doesn't work well. At this point, you should have an image
like this:
-
Now we're going to draw a triangular mesh between all of these dots.
- Click the eye next to the "points" layer to make it invisible (just to get it out of the way - you should still see your dots).
- Use the pen tool to draw
a line between the centers of the dots. You want to make sure you don't
have any crossing lines, or any gaps where you could fit another
triangle. If you keep the snap to object center enabled, it's much
easier to get the lines to end in the exact center of the circle - just hold
your pointer over the circle until it tells you the snap is on, then click.
In the end it'll look something like this:
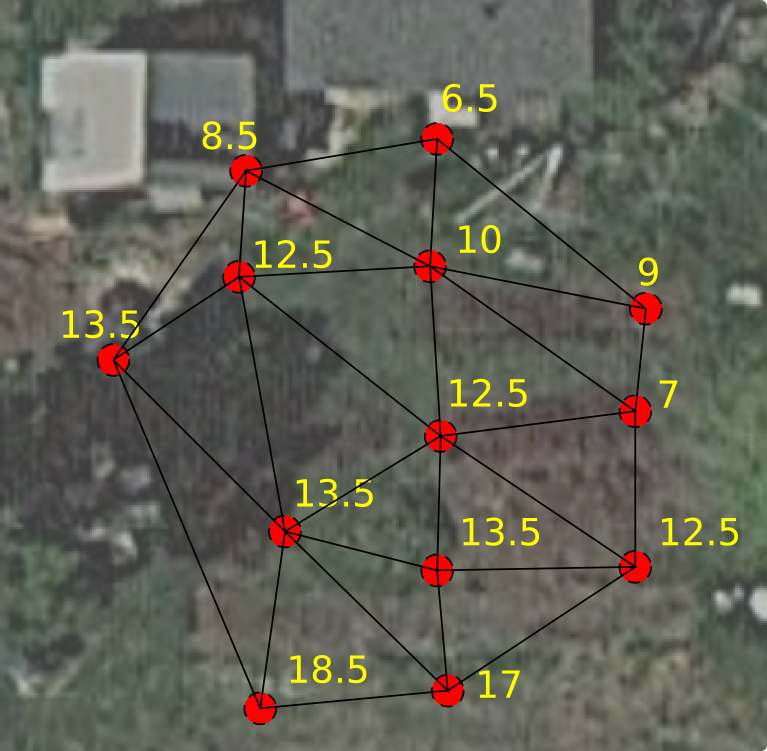
-
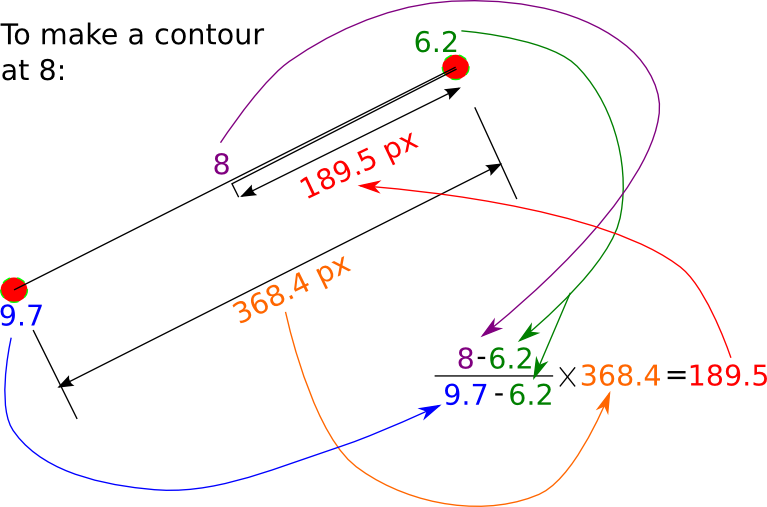
Draw a contour - finally! There's a bunch of calculating in this step, which I outline below. I'm going to set up a little calculator that you can run from inside your web browser also, and I'll update this post and send out an email to the list when I get that done.
- Pick a contour elevation to draw. This should be a whole-number elevation that's in the range of your dots. In this example, I'm going to draw a contour at ten inches (as measured on my transit). If you look at the dots and the heights, you can spot which dots the contour will pass between - they're connected by a line, and one is above 10 and the other below.
- Now you need to find the lines on your map that your contour will cross. One end of the line should have a higher elevation than your contour, and the other end should have a lower elevation. Any point that's exactly on the elevation will also be hit by the contour. This happens for the contour I'm drawing in the picture below.
- Now that you know which lines to cross, the next step is to figure out where exactly to cross them. To do this, we'll figure out how far from our lower elevation point we need to go along the line so that we'll be in the right spot.
- Using the pen tool (shift+F6),
start at the lower elevation point and measure the distance to the upper
elevation point.
- Now subtract the lower elevation from the upper elevation to get the total elevation change between the points.
- Now subtract the lower elevation from the contour elevation - this is how far up you need to go in elevation from the lower point to get to the contour elevation.
- Finally, divide the contour difference by the difference in the points, and then multiply the result by the inkscape distance you measured.
- The number you get out of all that is the distance you need to go up from the lower elevation point, along the line, to the point where your contour will cross. Draw a line segment to the right point with the pen tool, then make a little turn so you can see where it needs to cross.
- Repeat this sequence of steps for each line that your contour will cross.
- Now, use the pen tool to connect all of the points you marked, and you have a contour! When you get it all done, you can press n to enter node editing mode, then select the contour and press ctrl+a to select all of the nodes, then shift+S to make them smooth. That will make your contour look nice and smooth instead of jagged.
- Okay, now do that for each contour you want, and you're done!
Here's a picture showing where the various pieces of the calculation come from and what to do with them. It's a little confusing, but if you give it a couple of minutes I think it will help.
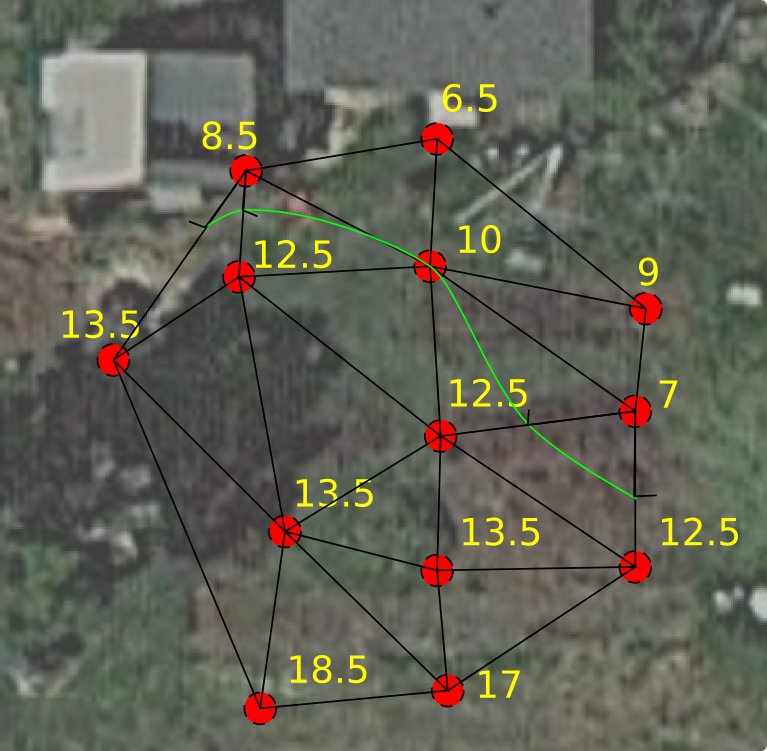
And here's what a contour will look like after you go through this process on your map (it's the green line):
PHEW! Okay, if you stuck with me through that, you should now have a very detailed contour map of a small section of your property, and you should have a strong sense of achievement at having done something very few people know how to do! Also, you may have a new-found respect for surveyors (I know I do)...