
Challenge 04 - Google Earth Contours
2014-04-22 00:00:00This post is part of a tutorial series explaining how I do permaculture designs using free software. Here are links to the rest of the series: Part one, Part two, Part three.
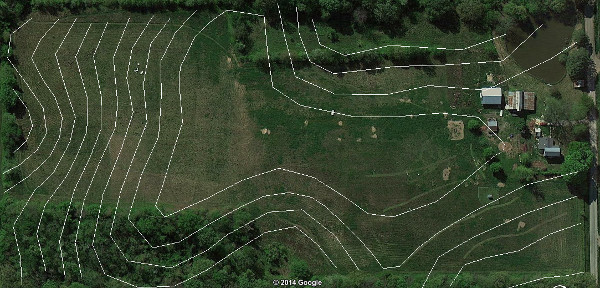
Okay, now that you have drawn some contours, let's figure out another way to get the data into your drawing. If you have a copy of Google Earth, you can use it's internal terrain model to get a decent approximation of your site's contours even without a contour map. I did this process on my site (see image above) to give me a comparison between the methods, and found that they're about the same. In my case, I actually mowed (with a lawn mower) contour lines onto my place and then Google's satellite imagery snapped them, so I have real contour lines on my map, like permaculture crop circles. This is not something you should rely on being able to do, by the way... However, it does give me a handy way to show the differences between data and ground truth.
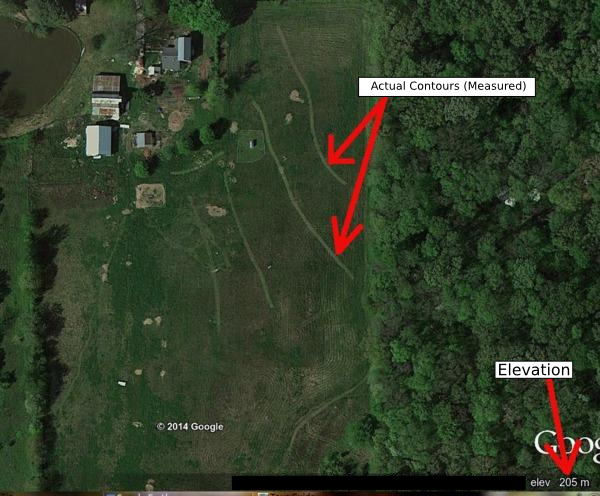
Here's a picture zoomed in on the contours I mowed. I also point out the elevation readout that we'll be using later in the lower right corner:
So, let's get on with it:
Getting familiar with the interface
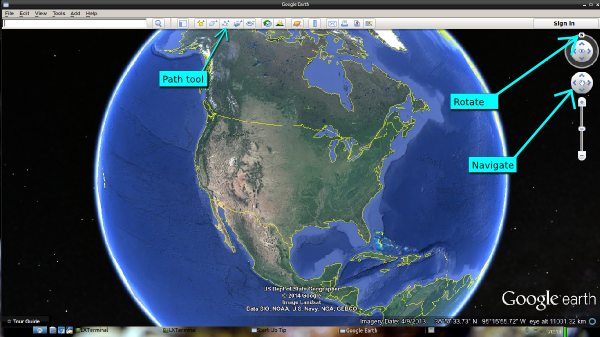
The first thing we'll need to do is get a little familiar with Google Earth's interface. For this tutorial, the main things you're going to want to use are the path tool, the navigation button, and the elevation display.
This image shows the locations of the path button, the navigation button (marked "navigate"), and the control you use to rotate the map so that North is not pointing up (useful to get a bigger view of your site in some cases - the image at the top of this page is an example). The elevation display is in the bottom right corner.
Marking contours with Google Earth is a simple, but tedious, process. Here's what we're going to do: use the elevation box on the lower right of the window to find spots that are the same elevation on our map, and draw lines between them. Then, move to another elevation and repeat.
There is only one subtlety with doing a good job on this: picking where you draw the line. Google Earth gives you elevation data, but it doesn't give you much precision on the elevation measurement (meaning you don't get a lot of digits after the decimal point, at least in a convenient-to-use way). What that means in practical terms is that there's a whole range of space within which Google Earth will tell you you're at the same elevation. On my site, the contours typically could have gone anywhere within about a 20 foot wide strip and still given the same readout for elevation.
Obviously, we want to do better than that. The trick is to tease out a little more precision by drawing our contour lines right at the border between one elevation level and the next. For example, if you're cruising around with the mouse at elevation 200m, there's a pretty big space where it will read as 200m even though the actual ground is not at 200m. However, the region where it changes from 200m to 201m is very tight, and will follow the actual contours as closely as possible given Google's data set. So that's what we're going to do in a nutshell - start out with your mouse at an elevation just below where you want the contour, then slowly move it uphill (on the site) until the point where it switches to your desired elevation. That's the place to draw the contour. This is a little more tedious than just drawing at any spot where the elevation reads right, but it'll pay off big time in precision.
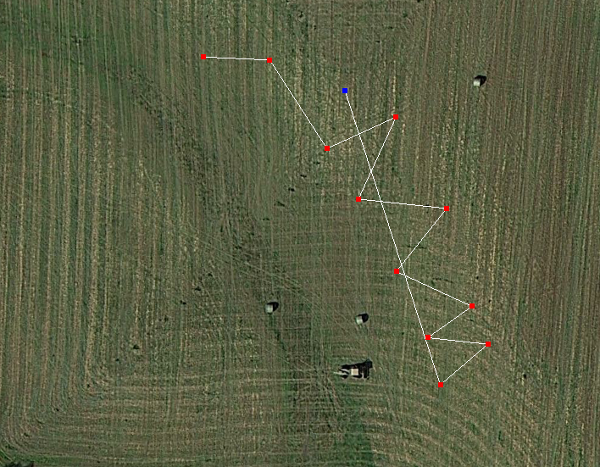
Here's an image that shows a pathological contour, just to show how bad it can get. All points on this line have an elevation reading of 195m according to Google Earth:
Here's the breakdown:
- Open Google Earth and navigate to your site
- Move your mouse pointer to a place where you'd like to start a contour line
- Look at the elevation number at the bottom right of the screen, then click the path tool (see images below for where these things are).
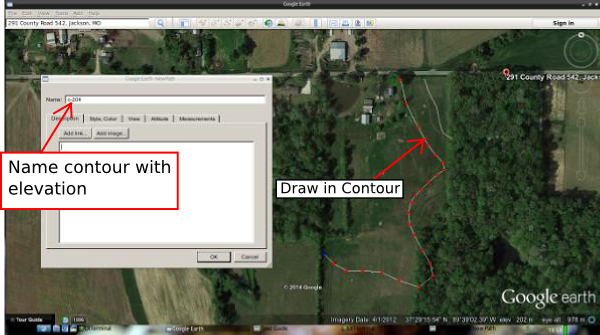
- Type a name for your contour in the window that pops up. I like to use names based on the elevation of the contour, something like c-290 meaning that it's the contour at elevation 290 meters. Don't close the window when you're done typing, or the path tool will not be selected!
- Move your mouse back to the place where you want to start a contour
- Move it downhill until the elevation is just less than your contour level
- Slowly go back uphill until just when it changes to the next elevation and click right there
- Move to the next location on your contour and repeat
- If you need to scroll the window around to continue drawing, you can do it by clicking the navigation button (see the interface key above). If you try to drag the map the normal way with the path tool selected, you'll draw more path segments where you don't want them.
- When you finish the contour, click Ok to save the path
- Repeat steps 2 through 6 for each contour, moving a set distance in elevation between each contour. This part's important if you want your contour map to give you a sense of slope. If you space them willy-nilly, it'll be really hard to tell where the steep parts and the flat parts of the property are.
Here's a screenshot of me doing this for the second contour on my map. You can
see the path window still open (it's pretty annoying actually, when you're
trying to draw a path).
Use Inkscape to make them smooth and vector-based
The last step of this tutorial is the same as the previous one (click here). You're basically going to take a screenshot of the contour map you just created, then import it into Inkscape and trace over the contours with the bezier tool, then smooth it all out.
Another note on error
You can get pretty good results with this process. Here's the map I ended up with for my site:
This image has some notes on it that describe a couple of the places where the contour map got a little off track:
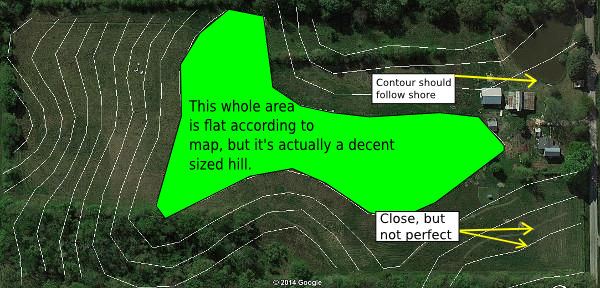
What you can see there is that my pond is not in their data set (otherwise the contour would follow the shore line) - this may be a pitfall of this approach if your site has been modified in the time between when they took the terrain survey and now. Also, the entire center portion of the site shows up on Google Earth as having the same elevation. This is not the case - the hill is not flat on top. In fact, the elevation data they have is missing at least three feet of elevation on the top of that hill (there should be another contour there). Finally, if you look at the bottom right part of the picture, you can see that I highlighted the places where I mowed contours based on survey transit measurements. The contours Google Earth gave me were decently close to this, so I took that as a sign of encouragement.
Postscript
If you are a Sketchup user, there's a pretty cool way to do this process that you might like better than what I've shown here. Check out this link to a youtube tutorial on contours with Sketchup+Google Earth.